Backtrace view
In the Backtrace view you can view or trace the functions called while running the program.
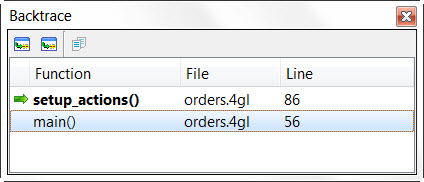
The first line displayed is the current line. Then the calling function is displayed, and so on, up to the main function. The Backtrace view is display-only. Lines are added in the output while the program is running.
An arrow points to the currently executing function.
The integrated Toolbar includes options to navigate a backtrace.
- Go to selected frame
- Make the selected frame the current frame. The Data view will be updated with the variables available in the selected frame.
- Go to source code
- Display the source code corresponding to the selected frame.